

Your agent.
Professional technical analysis.
A cross-asset technical analysis MCP service. Connect your agent to research trends, compare technical signals, find key levels and bring charts into the conversation.
You ask.
Your agent gets to work.
Stop piecing together answers across charts and indicators. Connect TradingSignal and let your agent choose the analysis your question needs.
- 01Explore the tools and connection settings
- 02Sign in and generate your API key
- 03Add it to your agent and start researching
Your agent can choose these tools as it works through your question.
search_symbolsFind a symbolget_method_analysisRead structured method analysisget_indicatorsInspect indicators and confluenceget_levelsGet support and resistanceget_chartBring charts into the conversation
{
  "mcpServers": {
    "tradingsignal": {
      "type": "http",
      "url": "https://tradingsignal.pro/mcp",
      "headers": {
        "Authorization": "Bearer YOUR_TS_API_KEY"
      }
    }
  }
}
Generate an API key, replace YOUR_TS_API_KEY, then add this to a client that supports HTTP MCP and custom headers.
Find the shortlist. Then go deeper.
Screen by technical confluence, trend strength, VCP patterns and other conditions to find the symbols worth a closer look.
Open screenerPreview the first 10 matches without signing up, or on a non-Pro account. Pro and Enterprise unlock full results.Structure, strength and the levels that matter.
Structured methods, proprietary trend signals, indicator confluence and support and resistance. Compare the evidence from every angle.
DeMark
Follow Setup and Countdown in the context of price.
02 / STRUCTUREChan Theory
Read strokes, segments, central zones and turning points.
03 / CONTRACTIONVCP
Screen contractions and examine volume and breakout conditions.
04 / PRICE & VOLUMEWyckoff
Connect price and volume with ranges, phases and key events.
05 / RETRACEMENTFibonacci
Choose anchors on the chart to study retracement and extension levels.
06 / PROPRIETARY SIGNALTrend strength
Our proprietary trend-strength signal tracks direction, changing strength and behavior across timeframes.
07 / TECHNICAL INDICATORSConfluence
Compare technical indicators for agreement, divergence and historical confluence.
08 / KEY LEVELSSupport & resistance
Bring support and resistance across timeframes into one view of key price levels.
Every view starts
with the chart.
Compare price action, indicators and structured methods in one workspace. See the signal — and the evidence behind it.
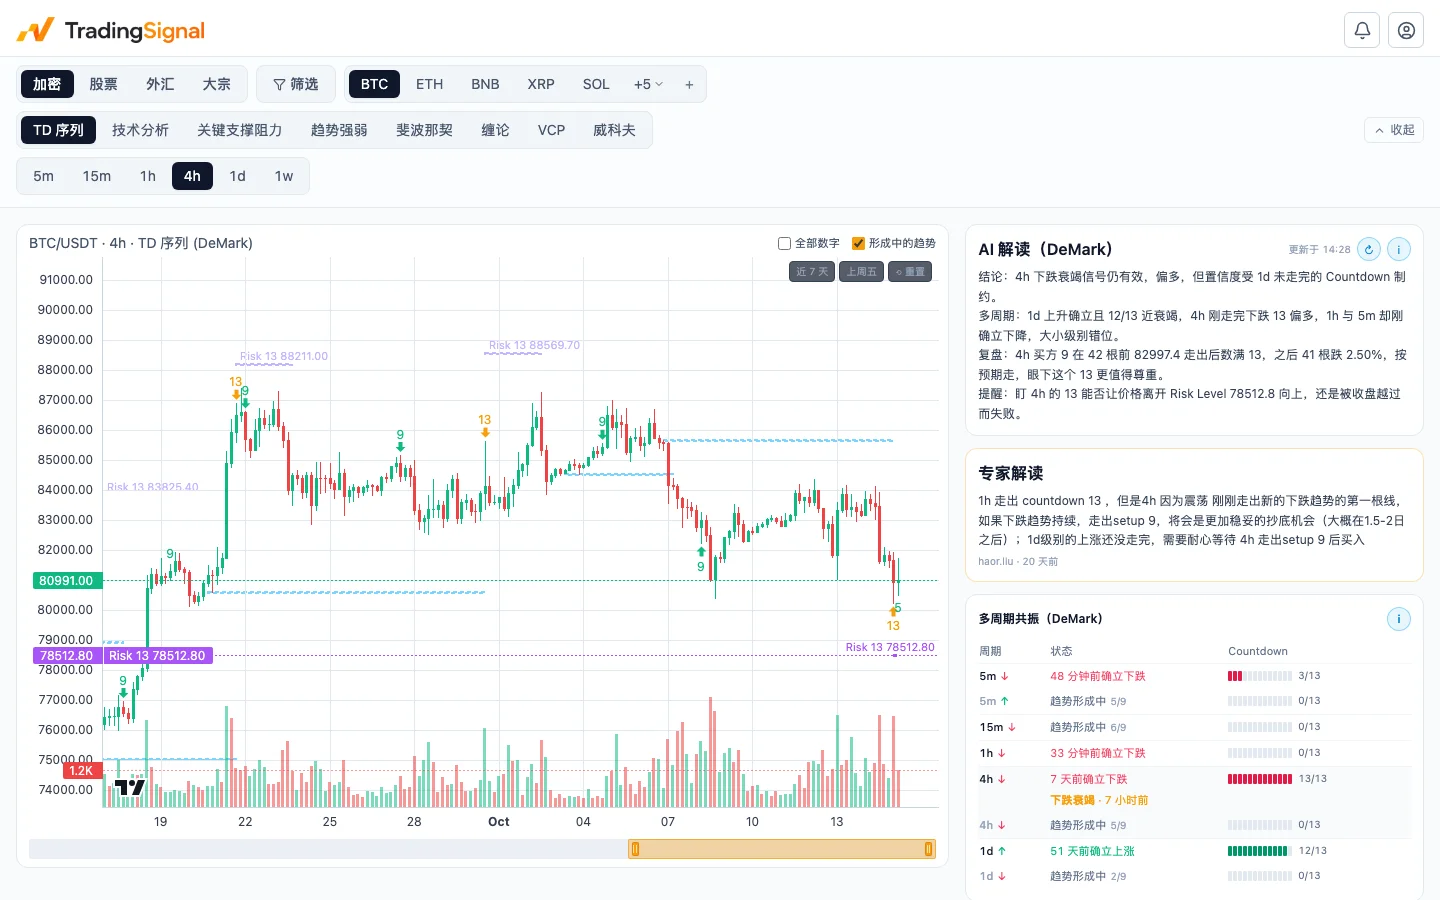
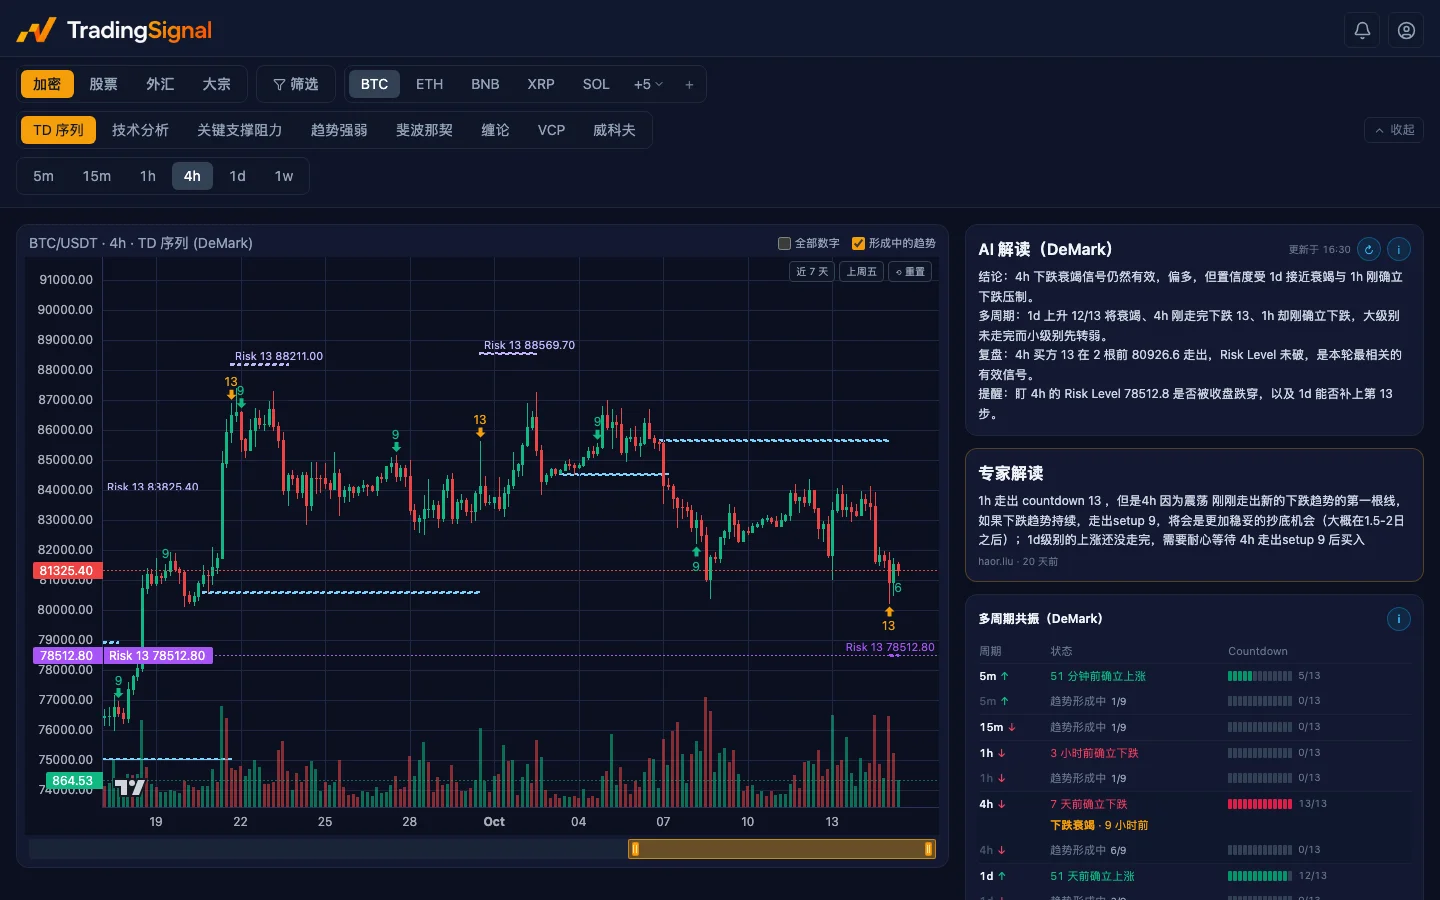
Multiple timeframesExamine the same market at different time scales.
Six indicator familiesTrend, momentum, volatility, volume, patterns and levels.
Analysis on demandTurn the current indicator snapshot into a readable analysis.
Choose access for your research.
Explore tools and setup first. API keys currently require Enterprise; other plans provide web charting access. See plan details for access and limits.
Free
Explore crypto markets
- Fixed list of 10 symbols
- Indicators and structured methods
Questions
What can I explore before connecting?
Browse tools, example configuration and analysis methods without signing up. Sign in and generate your API key when you are ready to make calls.
How do I connect my agent?
Copy the MCP configuration, replace the placeholder with your API key, and add it to a client supporting HTTP MCP and custom headers. See the setup guide for client-specific instructions.
Who can generate an API key?
API keys currently require Enterprise. Sign in to view access, create keys and manage them on the API page. Access and usage limits follow your account plan.
How are MCP and the API different?
MCP gives your agent analysis tools to choose from as it answers a question. The API is for applications and research workflows you build yourself.
Will my agent place trades?
No. TradingSignal provides market data, technical analysis and charts, not trade execution. The output supports research; trading decisions remain yours.